


Using Charts in an Ionic application
Charts are a keystone in a developer's career.
We generally arrive in a project where management wants to see information about the available data. D3.js is a well-known library that can do everything, however, we generally want something more simple to complete the tasks quickly.
In this tutorial, we will see how we can quickly add some slick Charts to an Ionic Angular application.
Vanilla Google Charts
We will start with Google's vanilla JS library. We only need to load the plugin in the index.html file:
<head>
  <script type="text/javascript" src="https://www.gstatic.com/charts/loader.js">
  </script>
  ...
And place a tag where we want to display the Google chart, here we add one in the home.page.html of our Ionic application:
<ion-content padding>
  <div id="pie-chart-div"></div>
</ion-content>
We can now switch to the home.page.ts file for the initialization:
  ...
  googleChartLibrary;

  ngOnInit() {
    this.useVanillaJSLibrary();
  }
We create a googleChartLibrary property that we will use later and launch the useVanillaJSLibrary method, which is as follow:
  useVanillaJSLibrary() {
    this.googleChartLibrary = (<any>window).google;
    // Load the Visualization API and the corechart package.
    this.googleChartLibrary.charts.load('current', { 'packages': ['corechart'] });

    // Set a callback to run when the Google Visualization API is loaded.
    this.googleChartLibrary.charts.setOnLoadCallback(this.drawChart.bind(this));
  }
We grab the google library from the window. TypeScript will tell us that window doesn't have the google proprety so we use a trick to transform the window object to "any" type and stock it in the googleChartLibrary property.
We then load the plugin with the corechart package, this package contains standard charts like pie, bar, etc.
After that, we specify what we want to do once the Google Charts API is loaded. Which is, use the following drawChart method:
// Callback that creates and populates a data table,
// instantiates the pie chart, passes in the data and
// draws it.
drawChart () {
// Create the data table.
var data = new this.googleChartLibrary.visualization.DataTable();
data.addColumn('string', 'Activity Name');
data.addColumn('number', 'Hours');
data.addRows([
['Sleeping', 8],
['Working', 8],
['TV', 2],
['Sports', 2],
['Eating', 2],
['Social', 2]
]);
// Instantiate and draw our chart, passing in some options.
var chart = new this.googleChartLibrary.visualization
.PieChart(document.getElementById('pie-chart-div'));
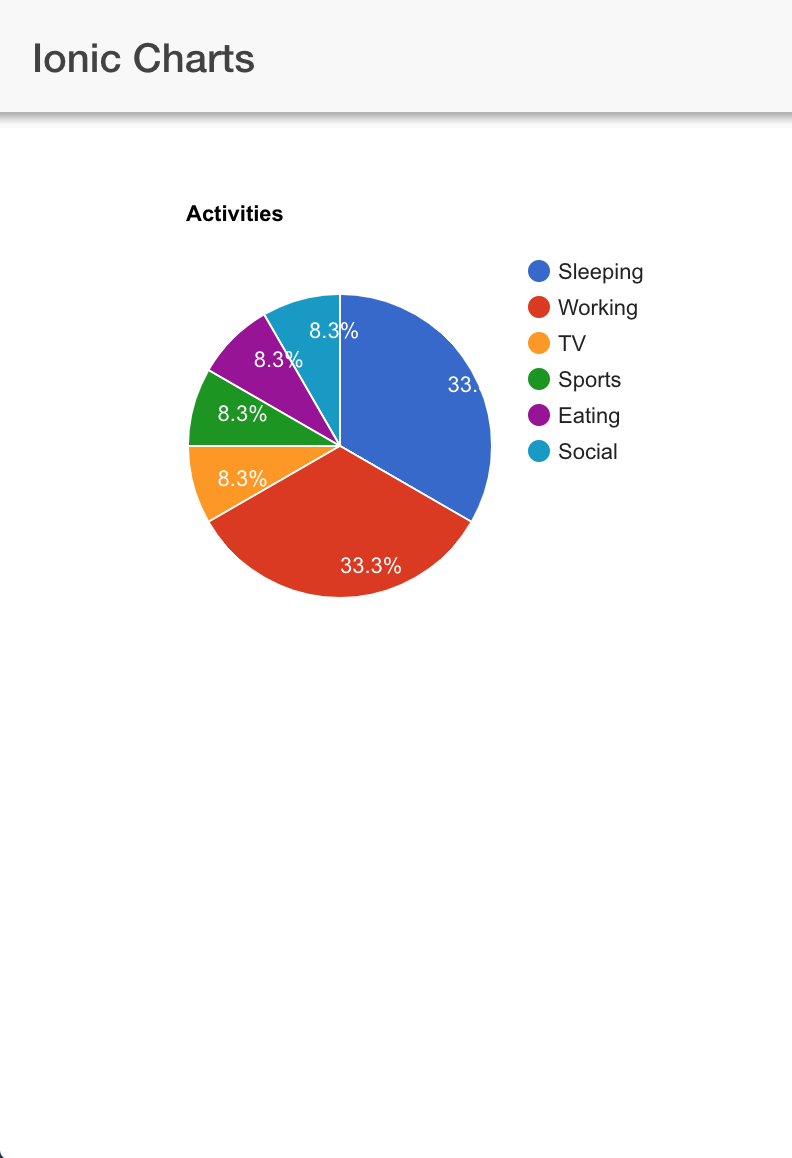
chart.draw(data, {
'title': 'Activities',
'width': 400,
'height': 300
});
}
The first part is the creation of the data that we will use, the columns represent the meaning of the data and the unit. The rows are the data content.
We create a Pie Chart by targetting the element which id is 'pie-chart-div'.
Finally we set the data and the options for our graph and here is our graph in our Ionic app:
Angular Google Graph
We have seen how we can use some Vanilla JS now let's see how we need to handle the Angular version.
We start by installing the library:
npm i -S ng2-google-charts
And adding it to our the home.module.ts file:
import { Ng2GoogleChartsModule } from 'ng2-google-charts';
...

@NgModule({
  imports: [
    CommonModule,
    FormsModule,
    IonicModule,
    RouterModule.forChild([
      {
        path: '',
        component: HomePage
      }
    ]),
    Ng2GoogleChartsModule
  ],
  declarations: [HomePage]
})
We can now use the <google-chart> directive in the home.page.html:
<ion-content padding>
  <google-chart [data]="pieChartData"></google-chart>
</ion-content>
We will use a pieChartData property initialized in the home.page.ts:
  pieChartData;

  ngOnInit() {
    this.useAngularLibrary();
  }
The last part is creating the chart data and configuration in a method named useAngularLibrary:
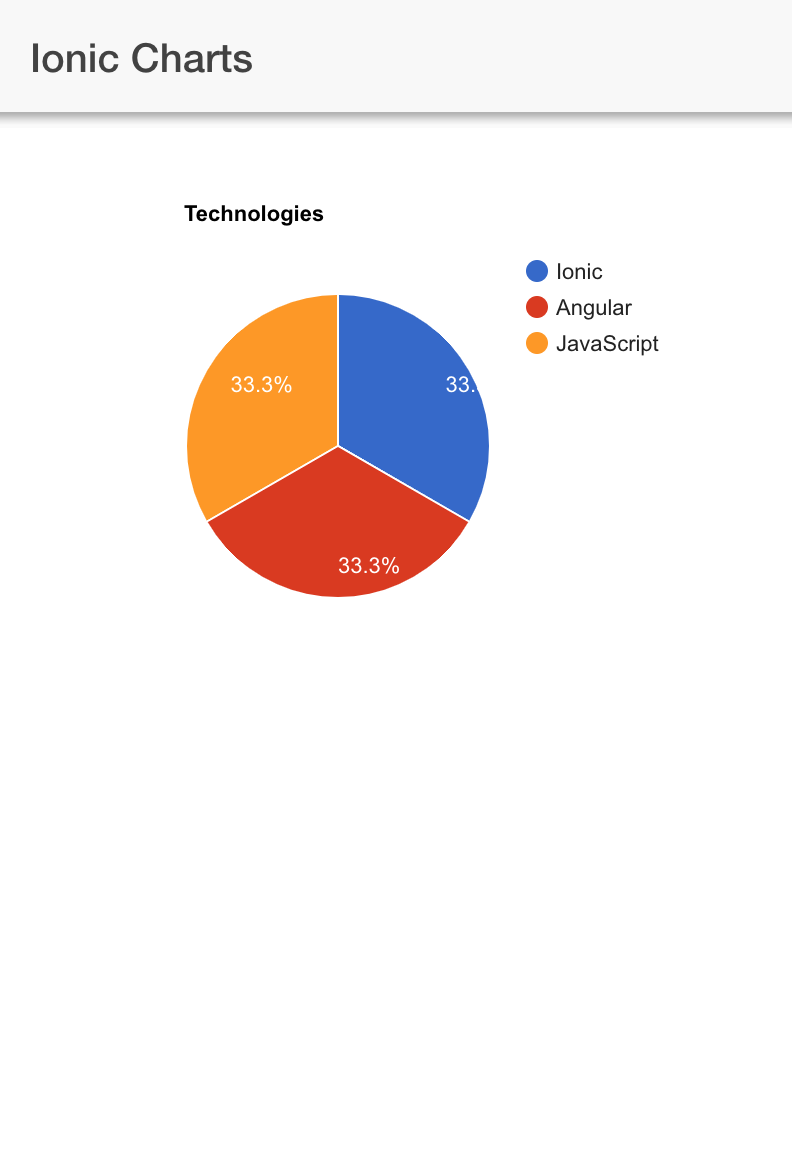
  useAngularLibrary() {
    this.pieChartData = {
      chartType: 'PieChart',
      dataTable: [
        ['Languages', 'Percent'],
        ['Ionic',     33],
        ['Angular',      33],
        ['JavaScript',  33]
      ],
      options: {
      'title': 'Technologies',
      'width': 400,
      'height': 300
      }
    };
  }
We stay with a PieChart type.
The dataTable is an array which first element describes its data, here we say that we are displaying 'Languages' using the 'Percent' unit. After that, we put our data as [string, number].
Leading us to this graph:
Let's not forget Webpack
We can now have our last example.
Since the Ionic Angular stack comes with Webpack let's see how we should use it.
This time we will use the Chart.js library.
Like before we install the library:
npm i -S chart.js
The home.page.html is a bit different:
<ion-content padding>
  <div style="position: relative; height:400px; width:400px">
    <canvas id="canvas-chart"></canvas>
  </div>
</ion-content>
We are going to use a canvas, we need to limit the size of the canvas with some CSS in a parent <div>.
We can now add the library to the home.page.ts file:
import Chart from 'chart.js';
The Webpack import is a bit smoother than adding it directly to the index.html file.
We call a useAnotherOneWithWebpack method on initialization:
  ngOnInit() {
    this.useAnotherOneWithWebpack();
  }
And we do the work:
  useAnotherOneWithWebpack() {
    var ctx = (<any>document.getElementById('canvas-chart')).getContext('2d');
    var chart = new Chart(ctx, {
        // The type of chart we want to create
        type: 'pie',

        // The data for our dataset
        data: {
            labels: ["January", "February", "March", "April", "May", "June", "July"],
            datasets: [{
              label: "My First dataset",
              backgroundColor: [
                'rgba(255, 99, 132, 0.2)',
                'rgba(54, 162, 235, 0.2)',
                'rgba(255, 206, 86, 0.2)',
                'rgba(75, 192, 192, 0.2)',
                'rgba(153, 102, 255, 0.2)',
                'rgba(255, 159, 64, 0.2)'
              ],
              borderColor: [
                'rgba(255,99,132,1)',
                'rgba(54, 162, 235, 1)',
                'rgba(255, 206, 86, 1)',
                'rgba(75, 192, 192, 1)',
                'rgba(153, 102, 255, 1)',
                'rgba(255, 159, 64, 1)'
              ],
              data: [0, 10, 5, 2, 20, 30, 45],
              borderWidth: 1
            }]
       }
    });
  }
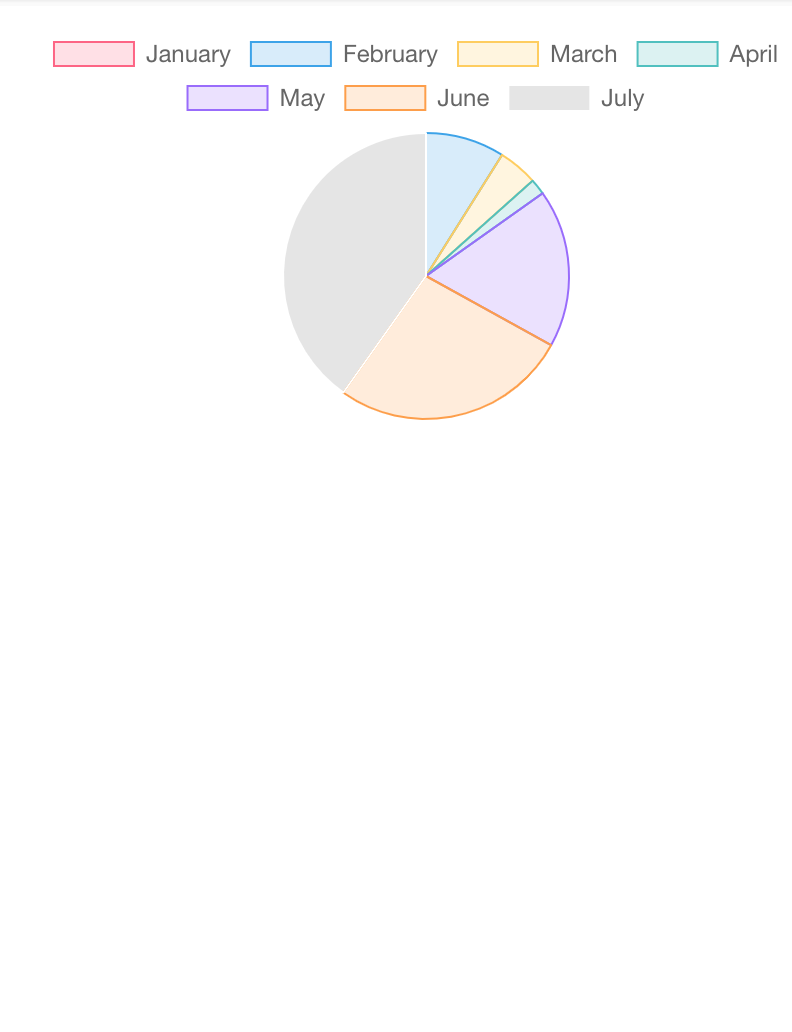
Like before, we target the correct element, but this time Chart.js needs the 2D context. We then use it to create a new pie chart.
The data property is set by setting the labels with its dataset which contains the data and other style information like the backgroundColor, the borderColor, etc.
And that's it our graph should now be displayed:
Conclusion
Graphs can be implemented very quickly.
We only need to allocate some space where the graph should be displayed, create a graph by targetting the specific element and initialize the data of our graph.
However, if we want something more customizable D3.js is the go-to tool.